


Every May, Long Island school districts put their budgets to a public vote, one of the rare moments when residents exercise direct democratic power over local spending. But as budget season heats up across Nassau and Suffolk Counties, the number that most often gets pulled out to help voters make sense of it all, per-pupil spending, tells only part of the story.
The math looks simple enough. Take the total budget, divide by total enrollment, and you get a tidy figure that lets you compare Huntington to Hempstead, or Smithtown to Riverhead. Clean. Comparable. And, according to education policy experts, misleading.
Per-pupil spending flattens the reality of what a school district actually does. A district’s enrollment might stay flat or even dip, but that doesn’t mean costs go down with it. Retirement contributions, general insurance, transportation infrastructure and collectively bargained salary increases don’t shrink because fewer kids walked through the door in September. These fixed and semi-fixed costs exist independent of how many students are sitting in classrooms.
Insurance costs are a particular pressure point right now. Even with New York State working to curb premium hikes, health and general insurance rates keep climbing. A modest premium increase can mean millions of dollars in additional spending for a single district, and most premiums aren’t increasing modestly at all. That kind of fluctuation doesn’t register in a per-pupil average. It just gets absorbed into the number and disappears.
Then there’s special education. No budget conversation on Long Island is complete without it.
Under the Individuals with Disabilities Education Act, districts are legally required to provide comprehensive programs tailored to students with disabilities. That can mean extra time on tests, specialized in-district instruction, or transportation to out-of-district residential facilities, each carrying a wildly different price tag.
New York State uses a multiplier of 1.41 to account for the added cost of educating students with disabilities. Multiply a student by 1.41, and that’s the funding weight the state assigns to their needs.
It’s a blunt instrument. A 2024 report from the Rockefeller Institute of Government put it plainly: “The 1.41 weighting is an oversimplification, as this one-size-fits-all approach inappropriately assumes that the service needs of all students with disabilities average out in a way that the costs can be met with a common level of funding,” the report said, “regardless of how service needs vary and any disproportionate presence of students with higher-cost needs.”
The same report added that capturing the full range of student conditions and service needs in a single flat adjustment “was largely viewed as restrictive and inflexible.”
Special education costs are also notoriously hard to predict from one year to the next. A student can move to a different district. A student’s needs can intensify. A child who needed minimal support at age seven might require a residential placement by age 12. None of those changes track neatly against total enrollment numbers, which means per-pupil spending won’t catch them coming.
New York already spends significantly more per pupil than the national average, driven largely by instructional salaries and benefits, according to the Empire Center for Public Policy. That fact alone invites scrutiny every budget season, and rightfully so. Taxpayers deserve to know where their money goes.
But the per-pupil figure, as Long Island Press has reported, doesn’t capture why costs rise or fall. It captures only the ratio that results after the budget is built.
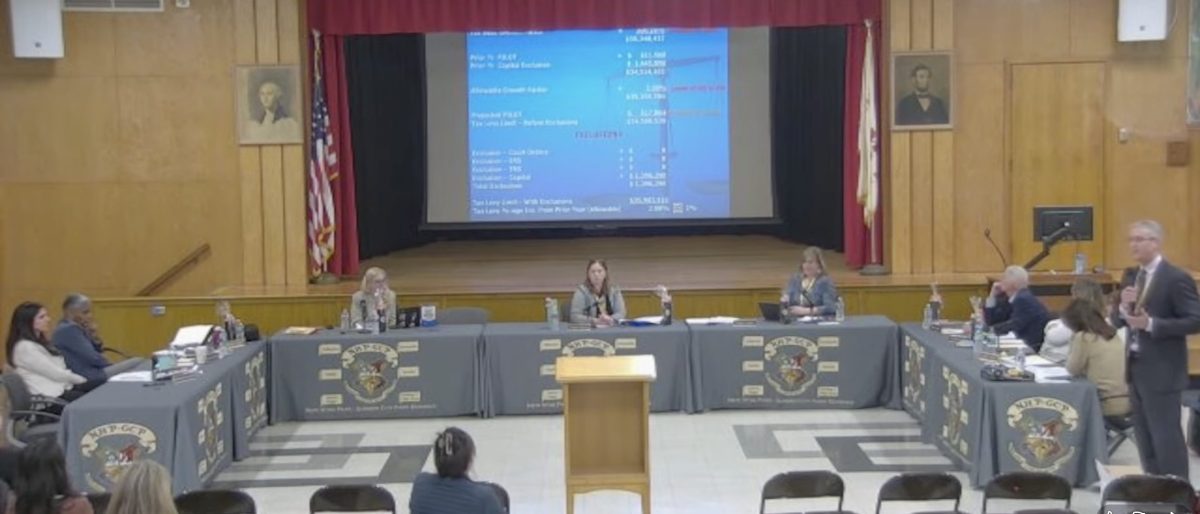
Districts across Long Island are legally required to share budget details publicly and hold hearings before the May vote. That transparency is real and worth protecting. What’s missing isn’t access to the data. It’s a broader public understanding of what the data actually means.
When Smithtown or North Hempstead voters see a per-pupil figure jump by $800 from last year, the instinct is to ask what the district is spending money on. That’s a fair question. But the answer often has less to do with how many kids are enrolled and more to do with a contract settlement, an insurance renewal, or a new out-of-district placement that nobody planned for in June. These aren’t line items that shrink when enrollment does. They’re structural costs baked into what it means to run a public school in New York State, and a single divided number won’t tell a voter which of those pressures is driving the bill higher.
Budget votes across Nassau and Suffolk Counties are scheduled for May 19, 2026. School districts are required to have detailed budget documents available to the public ahead of that vote.